

Cognitive reports in Power BI with R-script
As a continuation of my previous Sentiment & Phrase analysis using Cognitive Services via MSFlow will see the report creation part in PowerBI with r-script analytical capability.


To know more about measures and Data Analysis Expressions
Now, let's break down customer feedback. To create these reports we need following transformed columns(Measure columns) DAX are used for these types of transformations.
Happy-Count = CALCULATE ( COUNT(TA_Uservoice[TASentiment]),FILTER(TA_Uservoice, TA_Uservoice[TASentiment] >= 0.8)) + 0
Happy-Price-Sum = CALCULATE ( SUM(TA_Uservoice[ProductPrice]),FILTER(TA_Uservoice, TA_Uservoice[TASentiment] >= 0.8))+0
Neutral-Count = CALCULATE ( COUNT(TA_Uservoice[TASentiment]),FILTER(TA_Uservoice, TA_Uservoice[TASentiment] >= 0.5 && TA_Uservoice[TASentiment] < 0.8)) + 0
Neutral-Price-Sum = CALCULATE ( SUM(TA_Uservoice[ProductPrice]),FILTER(TA_Uservoice, TA_Uservoice[TASentiment] >= 0.5 && TA_Uservoice[TASentiment] < 0.8))+0
Frown-Count = CALCULATE ( COUNT(TA_Uservoice[TASentiment]),FILTER(TA_Uservoice, TA_Uservoice[TASentiment] >= 0 && TA_Uservoice[TASentiment] <= 0.4)) + 0
Frown-Price-Sum = CALCULATE ( SUM(TA_Uservoice[ProductPrice]),FILTER(TA_Uservoice, TA_Uservoice[TASentiment] >= 0 && TA_Uservoice[TASentiment] <= 0.4))+0

Now design the page as we did before or you can simply copy paste the controls from the previous screen. Once done perform below to view it visually


The above dataset is based on my Table schema, for better understanding I recommend you to read Sentiment & Phrase analysis using cognitive services article before proceeding.

final output

With the power of R-script, we can transform our existing table schema to an intelligent report and use the rich capability/accessibility/reusability of PowerBI in almost all modern apps to make better business decisions.
-Rathanavel

About PowerBI
Power BI is a business analytics solution that lets you visualize your data and share insights across your organization, or embed them in your app or website. Connect to hundreds of data sources and bring your data to life with live dashboards and reports. - PowerBI
About R-Script
R is a free software environment for statistical computing and graphics. R is an integrated suite of software facilities for data manipulation, calculation and graphical display. - R-projectLet get started, Open PowerBI


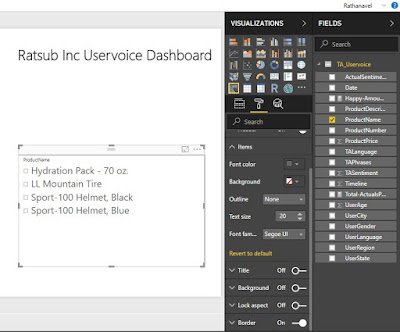
Now, design the form based on your requirement. Then, add master lookup filter "Product Name"

Configure it further

Adding Measure a.k.a DAX

Now, let's break down customer feedback. To create these reports we need following transformed columns(Measure columns) DAX are used for these types of transformations.
Total net sold product price
vs
1. Happy customer count and its value
2. Neutral customer count and its value
3. Frown customer count and its value
A. Happy count - Happy amount sum
B. Neutral count - Neutral amount sum
C. Frown count - Frown amount sum

Now design the page as we did before or you can simply copy paste the controls from the previous screen. Once done perform below to view it visually

Prepare AI Sentiment analysis weighage report using R script in PowerBI

Add the below script in R-Script editor

final output

With the power of R-script, we can transform our existing table schema to an intelligent report and use the rich capability/accessibility/reusability of PowerBI in almost all modern apps to make better business decisions.
-Rathanavel


I think this actually is a very descriptive blog about Power BI and some of its very crucial aspects.Thank you so much for providing this.
ReplyDeletePowerbi Read Rest